


Stunning Maps of Disasters
Take a look at these amazing maps showing earthquakes that have happened over the past 100 years throughout the world, and tornadoes that have hit America over the past 60 years. As you may have already seen in this website, disasters are on the increase and these maps just give us a glimpse into the frequency and intensity that we are experiencing with these disasters.
.
Earthquakes of Magnitude 4.0 and Greater Since 1898
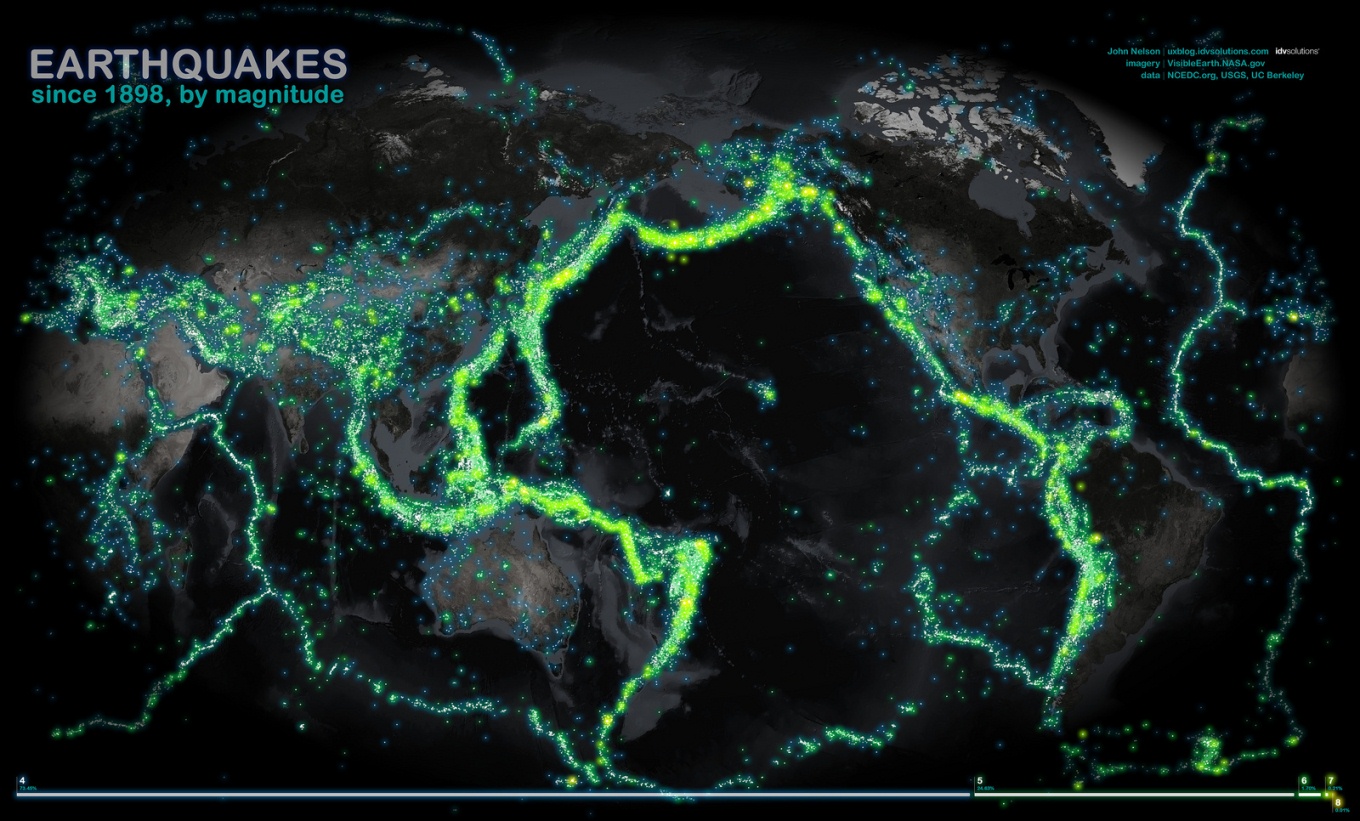
Click on the above image to get the full size map. Credit for the above map goes to: idvsolutions.com. On this amazing map you can see the plot of earthquakes worldwide of magnitude 4.0 or greater. The greater the "glow", the greater the number and intensity of earthquake is for that area. The picture also reveals the earths's tectonic boundaries in stunning bright luminous colour.
.
Tornado Tracks in America Since 1950
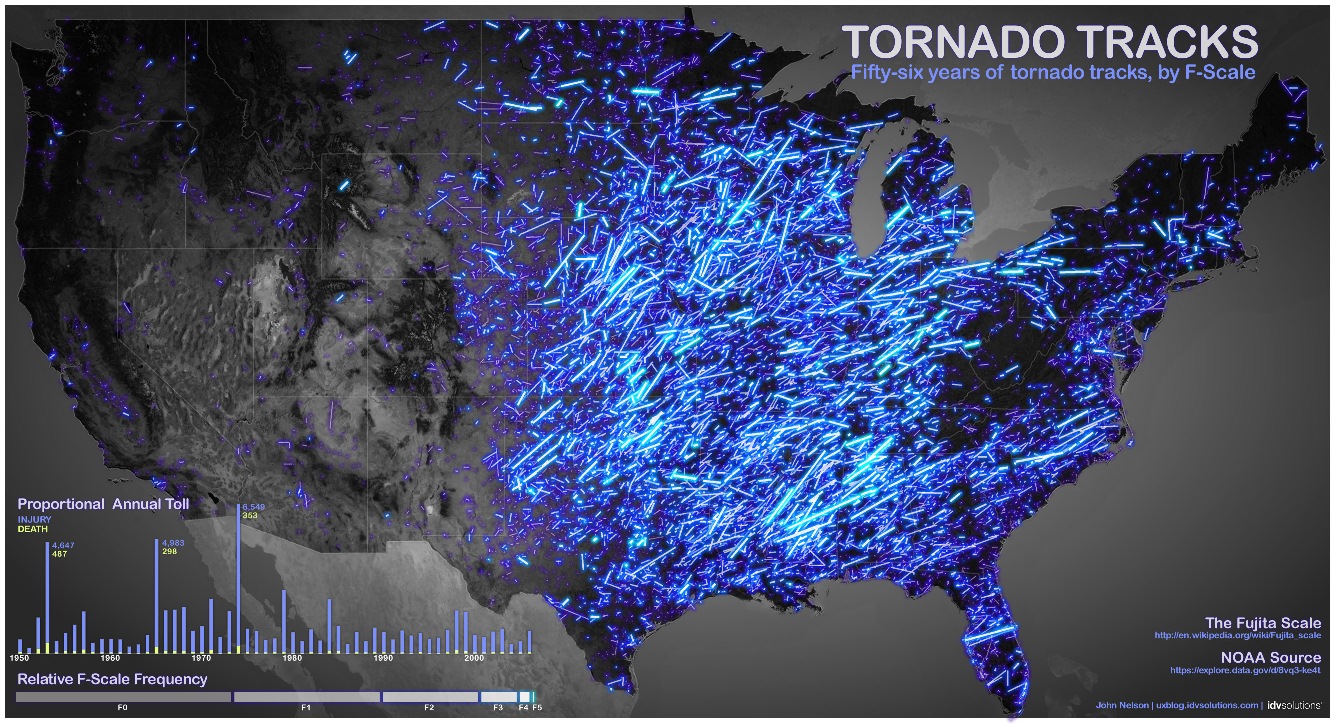
Click on the image for the full size map. Credit for the above map goes to: idvsolutions.com. This map shows a plot of tornadoes in America since 1950. If you go to the IDV website, you will see there more images of tornadoes split between the different years. And in 2011 it shows a massive increase in tornado activity.
I hope you enjoy these images. Remember, these signs taken on their own do not show that we are living in the end times. But when you put ALL the signs together that we have compiled throughout this website, then we can clearly see that we are living in the last days of this earth's history.

